Real-Time Network Monitoring
Comprehensive visibility into Solana blockchain performance metrics and network health indicators
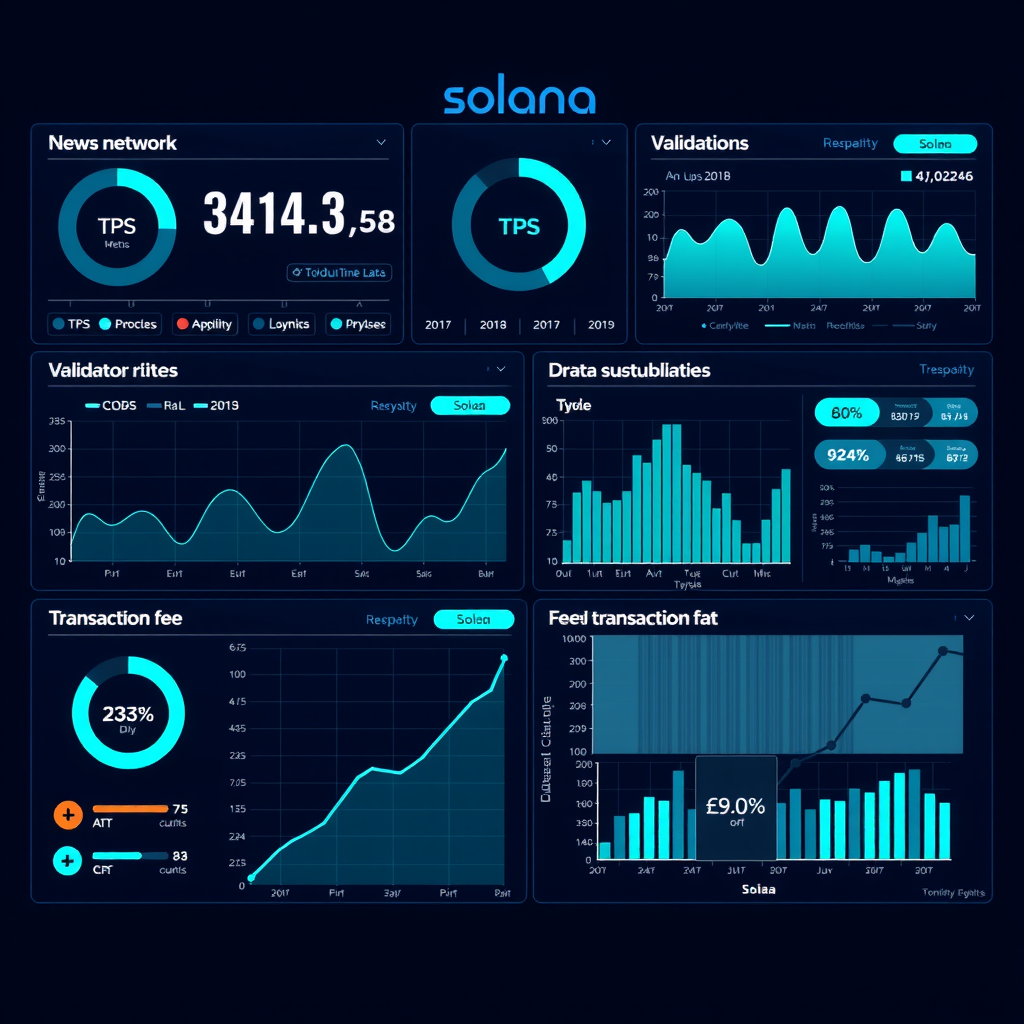
Advanced Network Monitoring Dashboard
Our real-time network monitoring service provides instant access to comprehensive Solana blockchain metrics, delivering the critical data you need to make informed decisions. Whether you're a developer optimizing transaction timing, a validator monitoring network health, or a trader analyzing market conditions, our advanced dashboard gives you complete visibility into the Solana network's performance.
Track every aspect of network performance with precision accuracy and millisecond-level updates, ensuring you never miss critical changes in network conditions that could impact your operations or trading strategies.
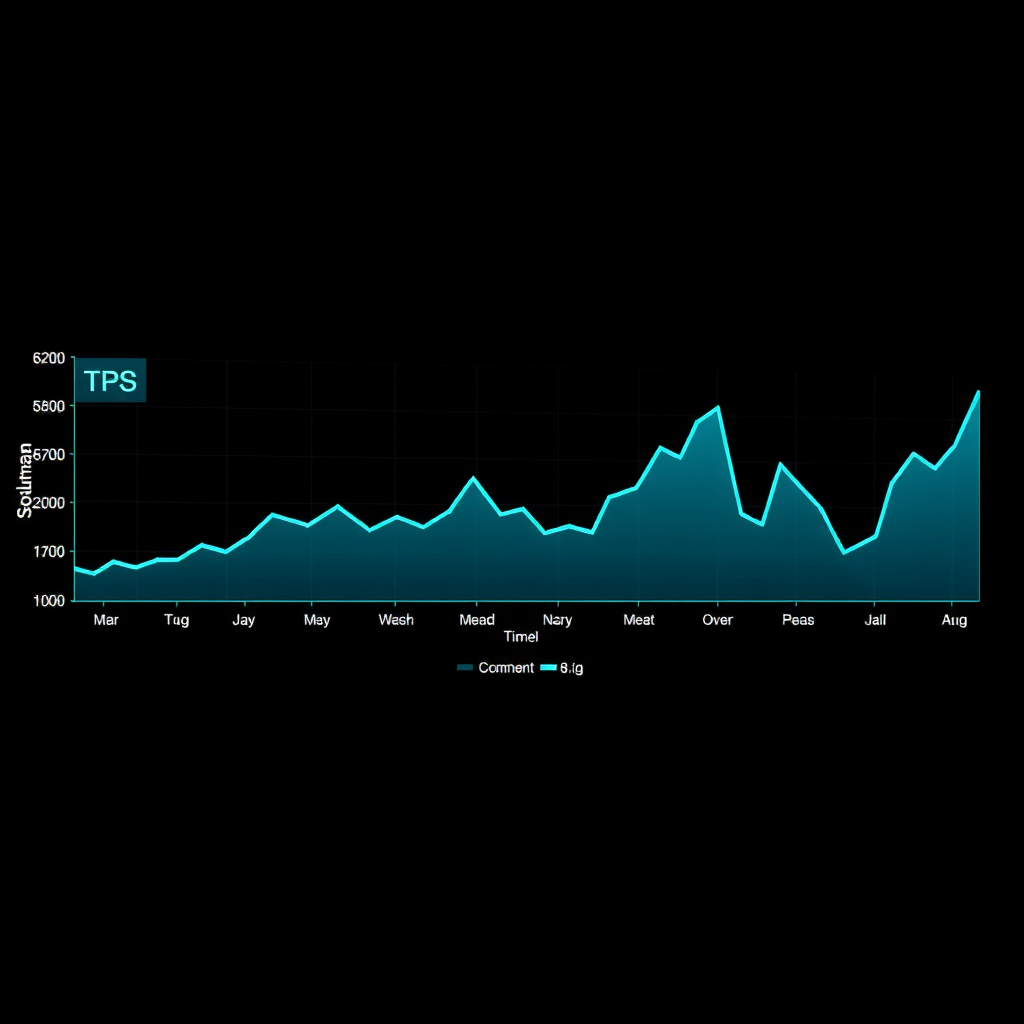
Transactions Per Second (TPS)
Monitor real-time TPS metrics to understand current network throughput and capacity utilization. Our system tracks both current TPS and historical averages, providing context for network performance trends.
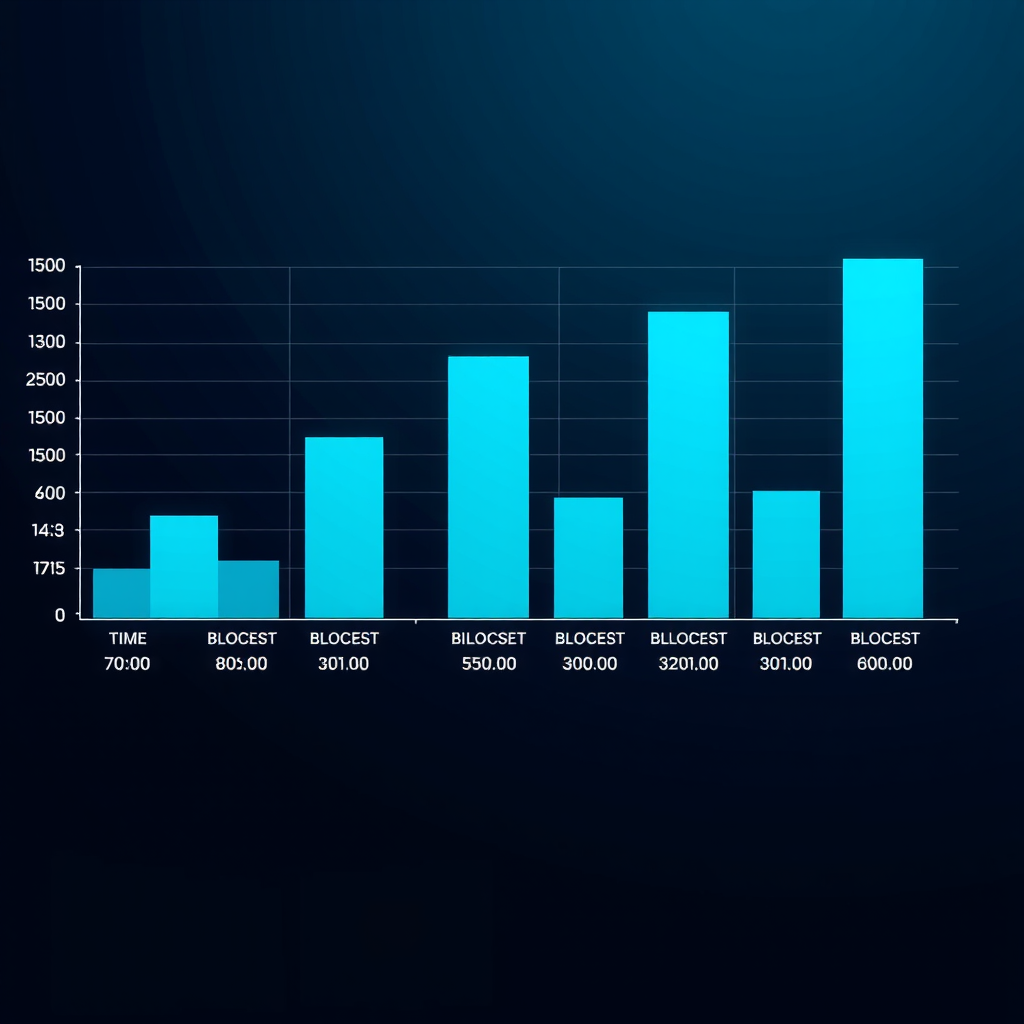
Block Production Rates
Track block production speed and consistency across the network. Identify any slowdowns or irregularities in block creation that might indicate network congestion or validator issues.
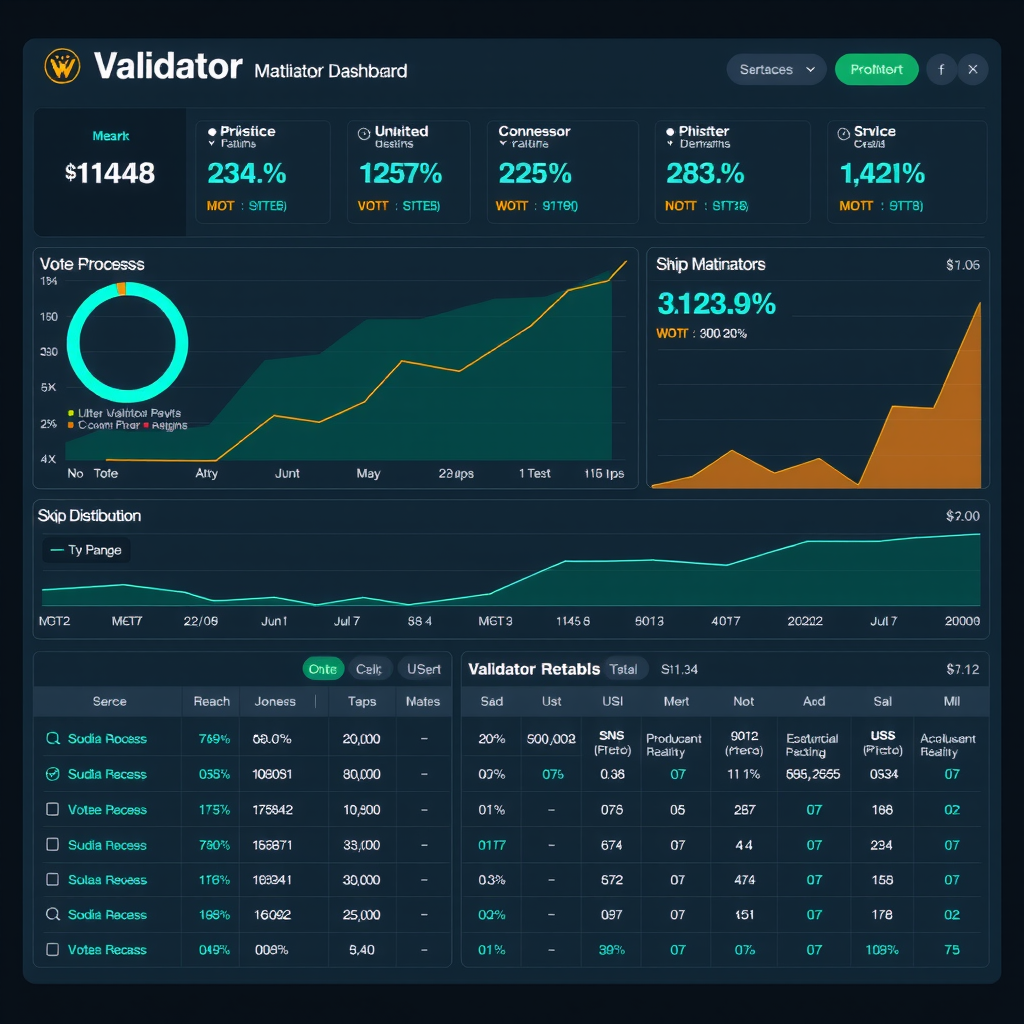
Validator Performance Metrics
Access detailed performance data for all active validators on the Solana network. Our monitoring system tracks validator uptime, vote success rates, skip rates, and stake distribution to provide a complete picture of validator health and reliability.
Understanding validator performance is crucial for network participants who need to assess network decentralization, identify reliable validators for staking, or monitor their own validator operations. Our real-time data helps you make informed decisions about validator selection and network participation.
Network Health Status
Real-time health indicators showing overall network stability, consensus status, and any active issues or degradations affecting performance.
Congestion Levels
Monitor current network congestion with color-coded indicators showing transaction queue depth and processing delays for optimal timing.
Transaction Fees
Track average transaction fees in real-time to optimize your transaction costs and understand current network demand dynamics.
Epoch Progression Tracking
Stay informed about current epoch status and progression with detailed tracking of epoch completion percentage, remaining time, and slot progression. Understanding epoch timing is essential for validators managing stake accounts and for developers coordinating time-sensitive operations.
Our epoch monitoring provides precise countdown timers, historical epoch performance data, and predictions for epoch completion based on current network conditions. This information helps you plan validator maintenance windows, stake account updates, and other epoch-dependent activities.
Who Benefits from Real-Time Monitoring
Developers
Optimize transaction timing and gas fees by monitoring network congestion. Debug application issues by correlating them with network performance metrics. Plan deployment windows during low-congestion periods.
Validators
Monitor your validator's performance against network averages. Track uptime, vote success rates, and skip rates. Identify and resolve performance issues before they impact rewards or reputation.
Traders
Make informed trading decisions based on network health and congestion levels. Time transactions to minimize fees during low-congestion periods. Assess network reliability for high-value transactions.
Instant Network Visibility
Our real-time monitoring dashboard updates every second, providing you with the most current network data available. Whether you're managing critical infrastructure, developing applications, or trading digital assets, having instant access to accurate network metrics gives you the competitive edge you need in the fast-paced Solana ecosystem.
Join thousands of developers, validators, and traders who rely on our monitoring service to stay informed about Solana network performance and make data-driven decisions with confidence.